Non-intrusive Performance Failure Diagnosis for Distributed Server Stacks
Introduction
Nowadays distributed server stacks such as Apache Hadoop and Spark play an important role in large companies’ software infrastructure. However, failure diagnosis of distributed systems is notoriously difficult and extremely time-consuming. The long-term goal of this research project is to completely automate the process of distributed system failure diagnosis. Our experience studying distributed sytem failures reveals that the debugging process is, in fact, highly mechanical and can be automated with tools that follow the same principles as human intuition.
With these insights, we built two non-instrusive tools, lprof and Stitch, to help developers and system administrators understand distributed system performance. Both of them have great potential: lprof is already deployed in a world-class IT company to improve their engineers’ productivity in failure diagnosis; And our user study shows Stitch can speedup the process of debugging by a factor of 4.6 compared with manually analyzing the raw logs.
Publications
Non-Intrusive Performance Profiling for Entire Software Stacks Based on the Flow Reconstruction Principle
by Xu Zhao, Kirk Rodrigues, Yu Luo, Ding Yuan, and Michael Stumm, University of Toronto
Published and presented at OSDI ‘16. View the Paper or Slides.
Abstract
Understanding the performance behavior of distributed server stacks at scale is non-trivial. The servicing of just a single request can trigger numerous sub-requests across heterogeneous software components; and many similar requests are serviced concurrently and in parallel. When a user experiences poor performance, it is extremely difficult to identify the root cause, as well as the software components and machines that are the culprits. This paper describes Stitch, a non-intrusive tool capable of profiling the performance of an entire distributed software stack solely using the unstructured logs output by heterogeneous software components. Stitch is substantially different from all prior related tools in that it is capable of constructing a system model of an entire software stack without building any domain knowledge into Stitch. Instead, it automatically reconstructs the extensive domain knowledge of the programmers who wrote the code; it does this by relying on the Flow Reconstruction Principle which states that programmers log events such that one can reliably reconstruct the execution flow a posteriori.
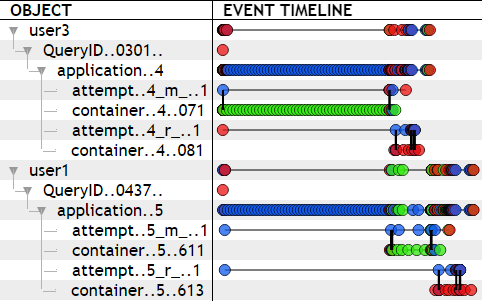
Object Hierarchy and Event Timeline
Using the principle, Stitch is able to automatically reconstruct the hierarchy between logged objects and then display them on a timeline according to their events (as shown below). Over three software stacks - OpenStack, Hadoop, and Spark - Stitch is able to reconstruct objects with 96% accuracy.
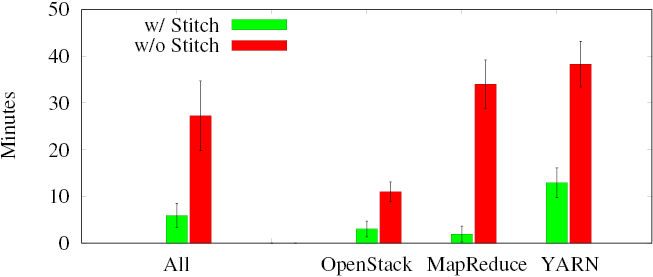
User Study Result
A user study on three different debugging and profiling tasks shown below demonstrates that Stitch can speedup the process by at least 4.6x compared to manually analyzing the raw logs using traditional text processing tools (grep, awk, sed, etc.).
lprof: A Non-intrusive Request Flow Profiler for Distributed Systems
by Xu Zhao, Yongle Zhang, David Lion, Muhammad Faizan Ullah, Yu Luo, Ding Yuan, and Michael Stumm, University of Toronto.
Published in and presented at OSDI '14. View the Paper.
Abstract
Applications implementing cloud services, such as HDFS, Hadoop YARN, Cassandra, and HBase, are mostly built as distributed systems designed to scale. In order to analyze and debug the performance of these systems effectively and efficiently, it is essential to understand the performance behavior of service requests, both in aggregate and individually.
lprof is a profiling tool that automatically reconstructs the execution flow of each request in a distributed application. In contrast to existing approaches that require instrumentation, lprof infers the request-flow entirely from runtime logs and thus does not require any modifications to source code. lprof first statically analyzes an application’s binary code to infer how logs can be parsed so that the dispersed and intertwined log entries can be stitched together and associated to specific individual requests.
We validate lprof using the four widely used distributed services mentioned above. Our evaluation shows lprof ’s precision in request extraction is 88%, and lprof is helpful in diagnosing 65% of the sampled real-world performance anomalies.